

Share this article:



Key Takeaways from this article
- Schedule dependencies and available float determine how many milestones a schedule change moves, and by how much.
- Seeing a schedule change early gives the team time to adjust the sequence before key dates slip.
- Milestone trend analysis keeps every earlier forecast, so the team can see when a risk first appeared.
- A reason recorded as soon as a milestone moves gives the team reliable facts for the next decision.
- Owners trust a completion date when every change is traceable, the original baseline stays visible and site progress backs the revised plan.
Eleven of 13.
That is how many major U.S. federal building projects completed in fiscal year 2020 took longer than originally planned, according to the U.S. Government Accountability Office (GAO). Delays like these build up one change at a time. Each change raises the question every project team knows all too well: what does this do to our completion dates?
What Is Milestone Trend Analysis?
Milestone trend analysis is a schedule control method that records the forecast date of each key milestone at successive reporting dates and plots how those forecasts change over time. Each new report adds a point to each open milestone’s trend line, so the project team can see how schedule changes affect completion dates while corrective action is still possible.
How the Milestone Trend Chart Works
A milestone trend chart, the visual output of milestone trend analysis (MTA), shows reporting dates on the horizontal axis and forecast dates on the vertical axis. Each milestone has its own trend line, which shows how its forecast develops from report to report.
In the standard chart layout, a diagonal marks every point where the reporting date and the forecast date are the same. When a line reaches the diagonal, the forecast date has arrived, and the team checks completion against the milestone’s agreed criterion. A line ends once completion is confirmed. An overdue milestone stays on the chart until it is done.
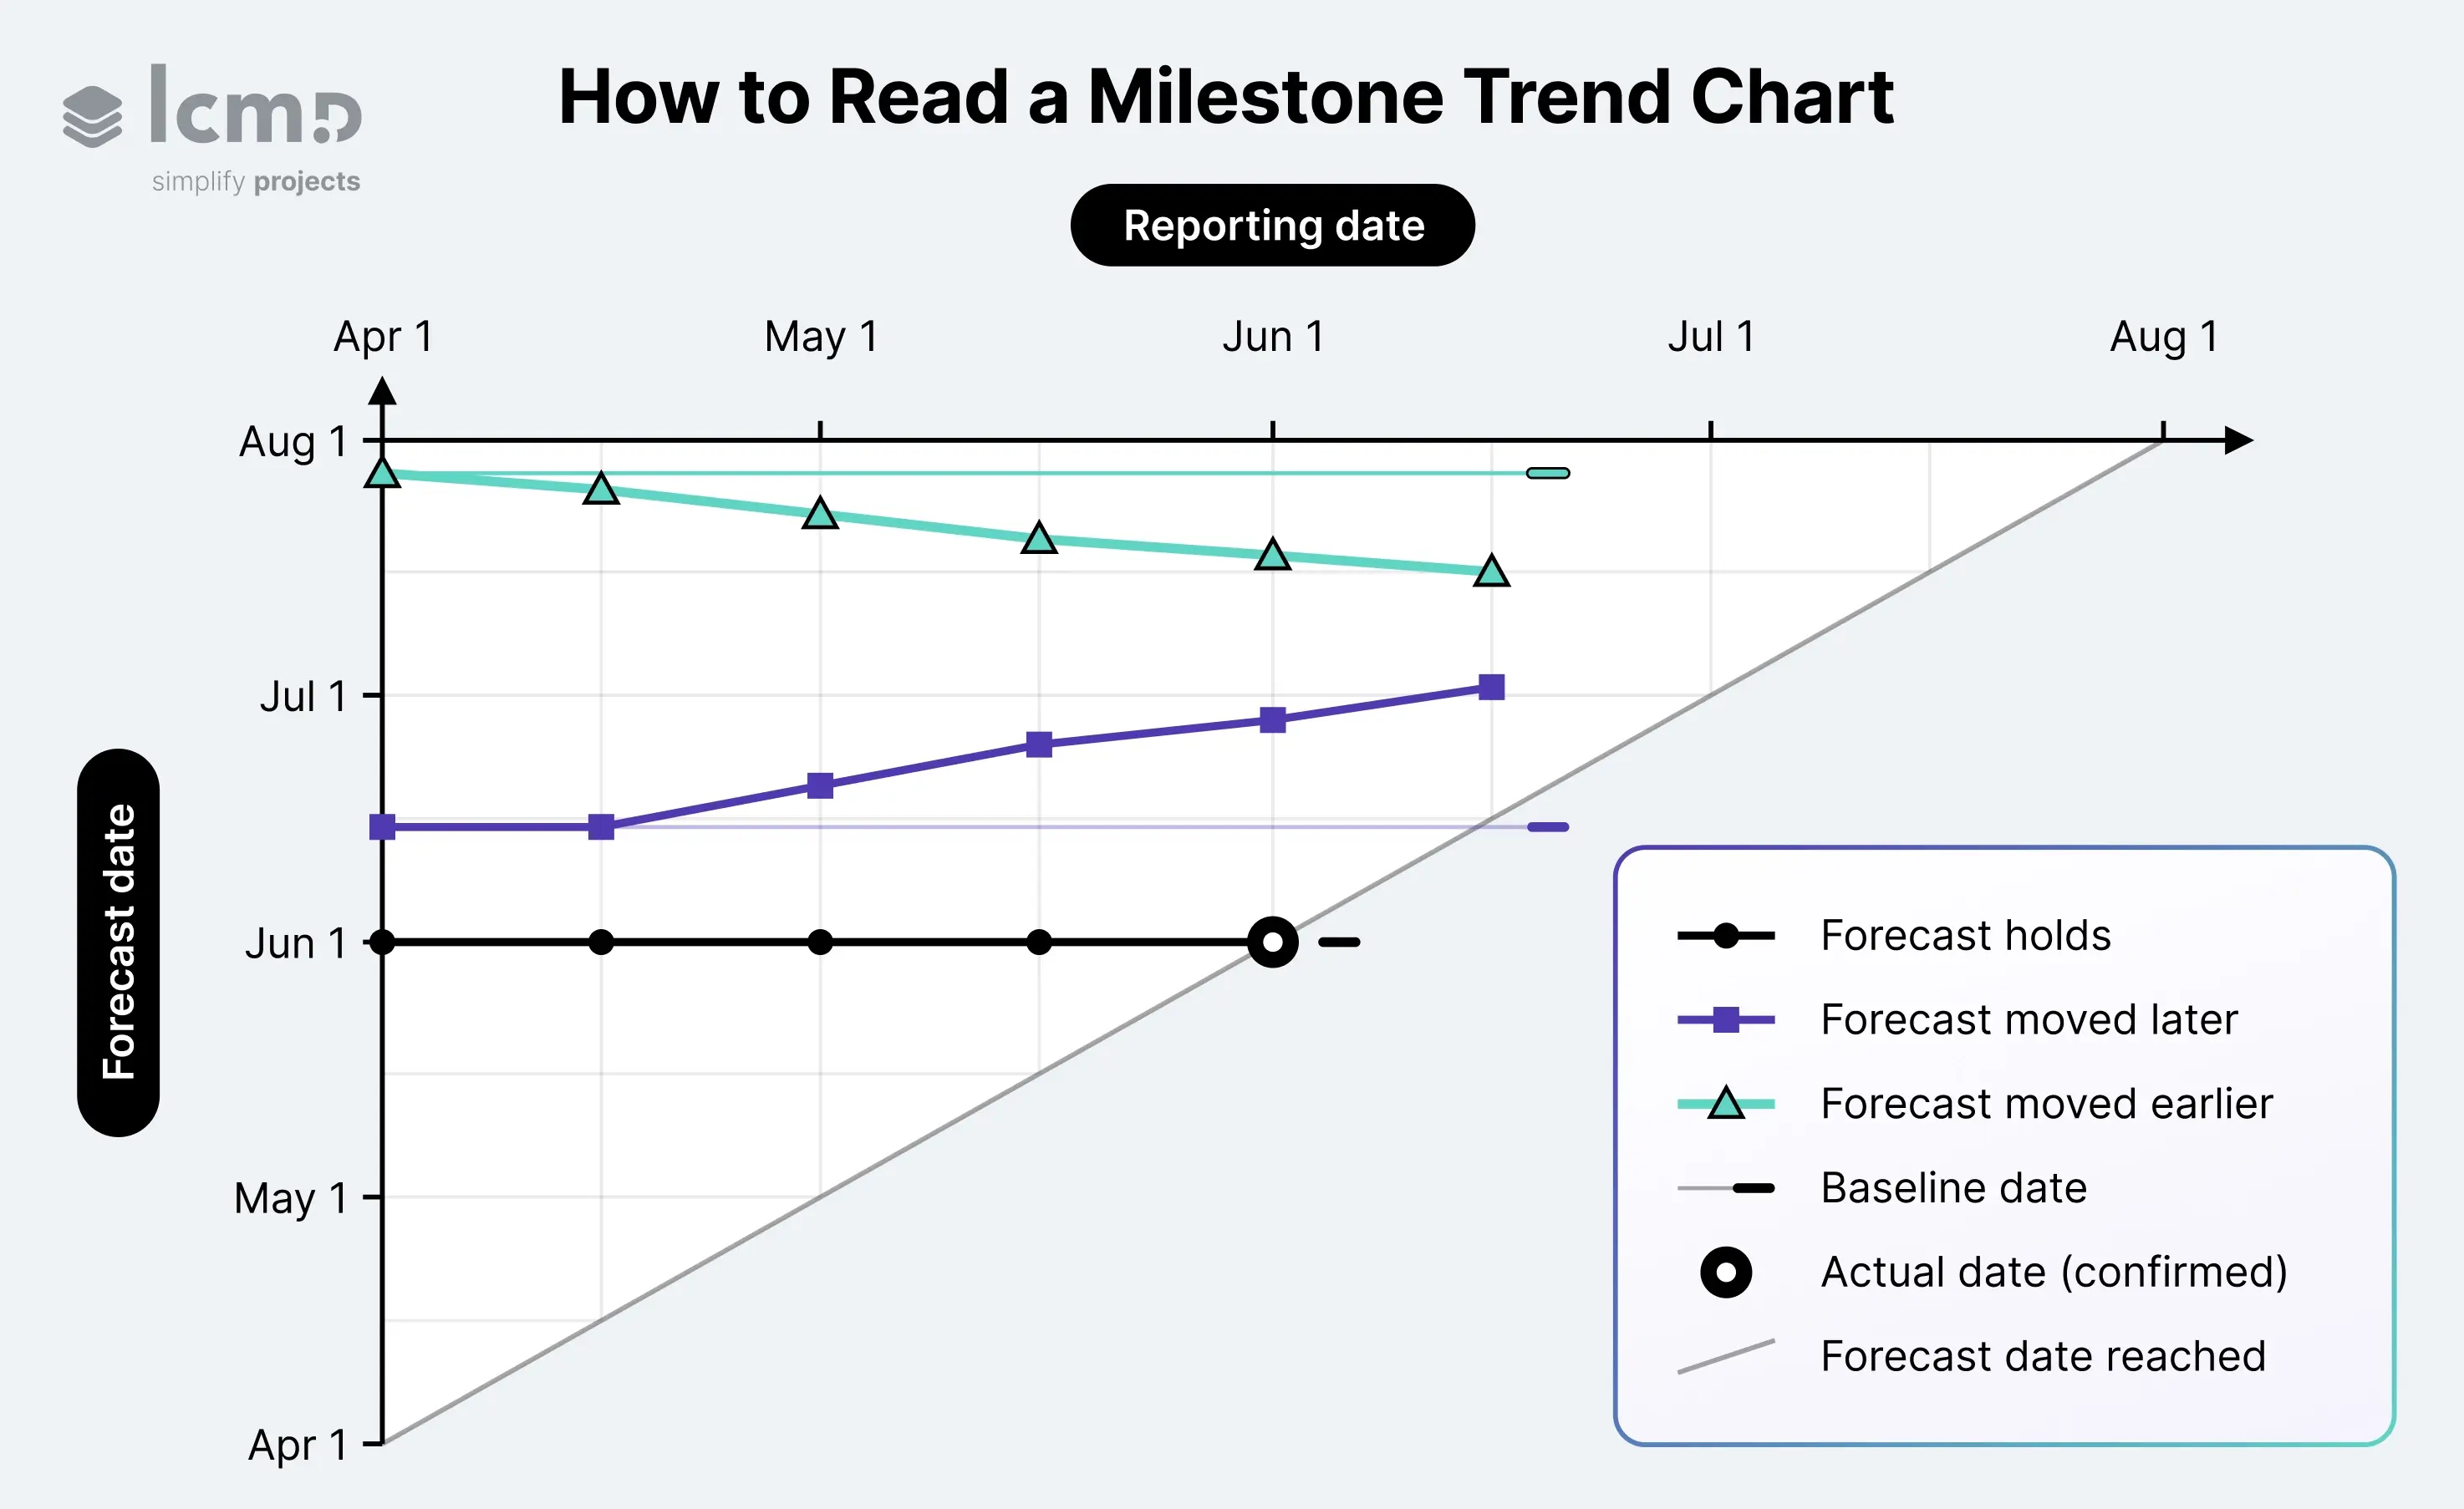
The reporting date on the horizontal axis shows when each forecast was recorded. Three other dates help the team evaluate each milestone:
- Baseline date: the originally approved milestone date, kept as a reference. A thin line with a short end bar marks it.
- Forecast date: the date the team expects the milestone to be reached, plotted on the vertical axis at each reporting date.
- Actual date: the date the milestone was achieved, recorded once completion is confirmed. The completion marker at the end of the trend line shows it.
Comparing successive forecasts with the baseline shows how expectations have changed. The following example shows what happens to those dates when one delivery is moved.
Milestone Trend Analysis Example: What One Schedule Change Does to Your Milestones
A three-week façade delivery delay puts three construction milestones at risk. This illustrative example follows its consequences through the schedule and across six reporting dates.
Four Key Milestones in a Commercial Building Project
A four-story commercial building project tracks four milestones and reviews their forecasts every two weeks.
Interior finishes can start once the building is weathertight and MEP rough-in is complete. MEP rough-in finishes on May 29, one week after the baseline weathertight date. This gives the façade-dependent sequence one week of float before it affects the start of finishes.
For this example, the schedule allows two weeks between final inspection and substantial completion for punch-list work and approvals. What substantial completion requires is set by the contract.
The Schedule Impact of a Three-Week Façade Delay
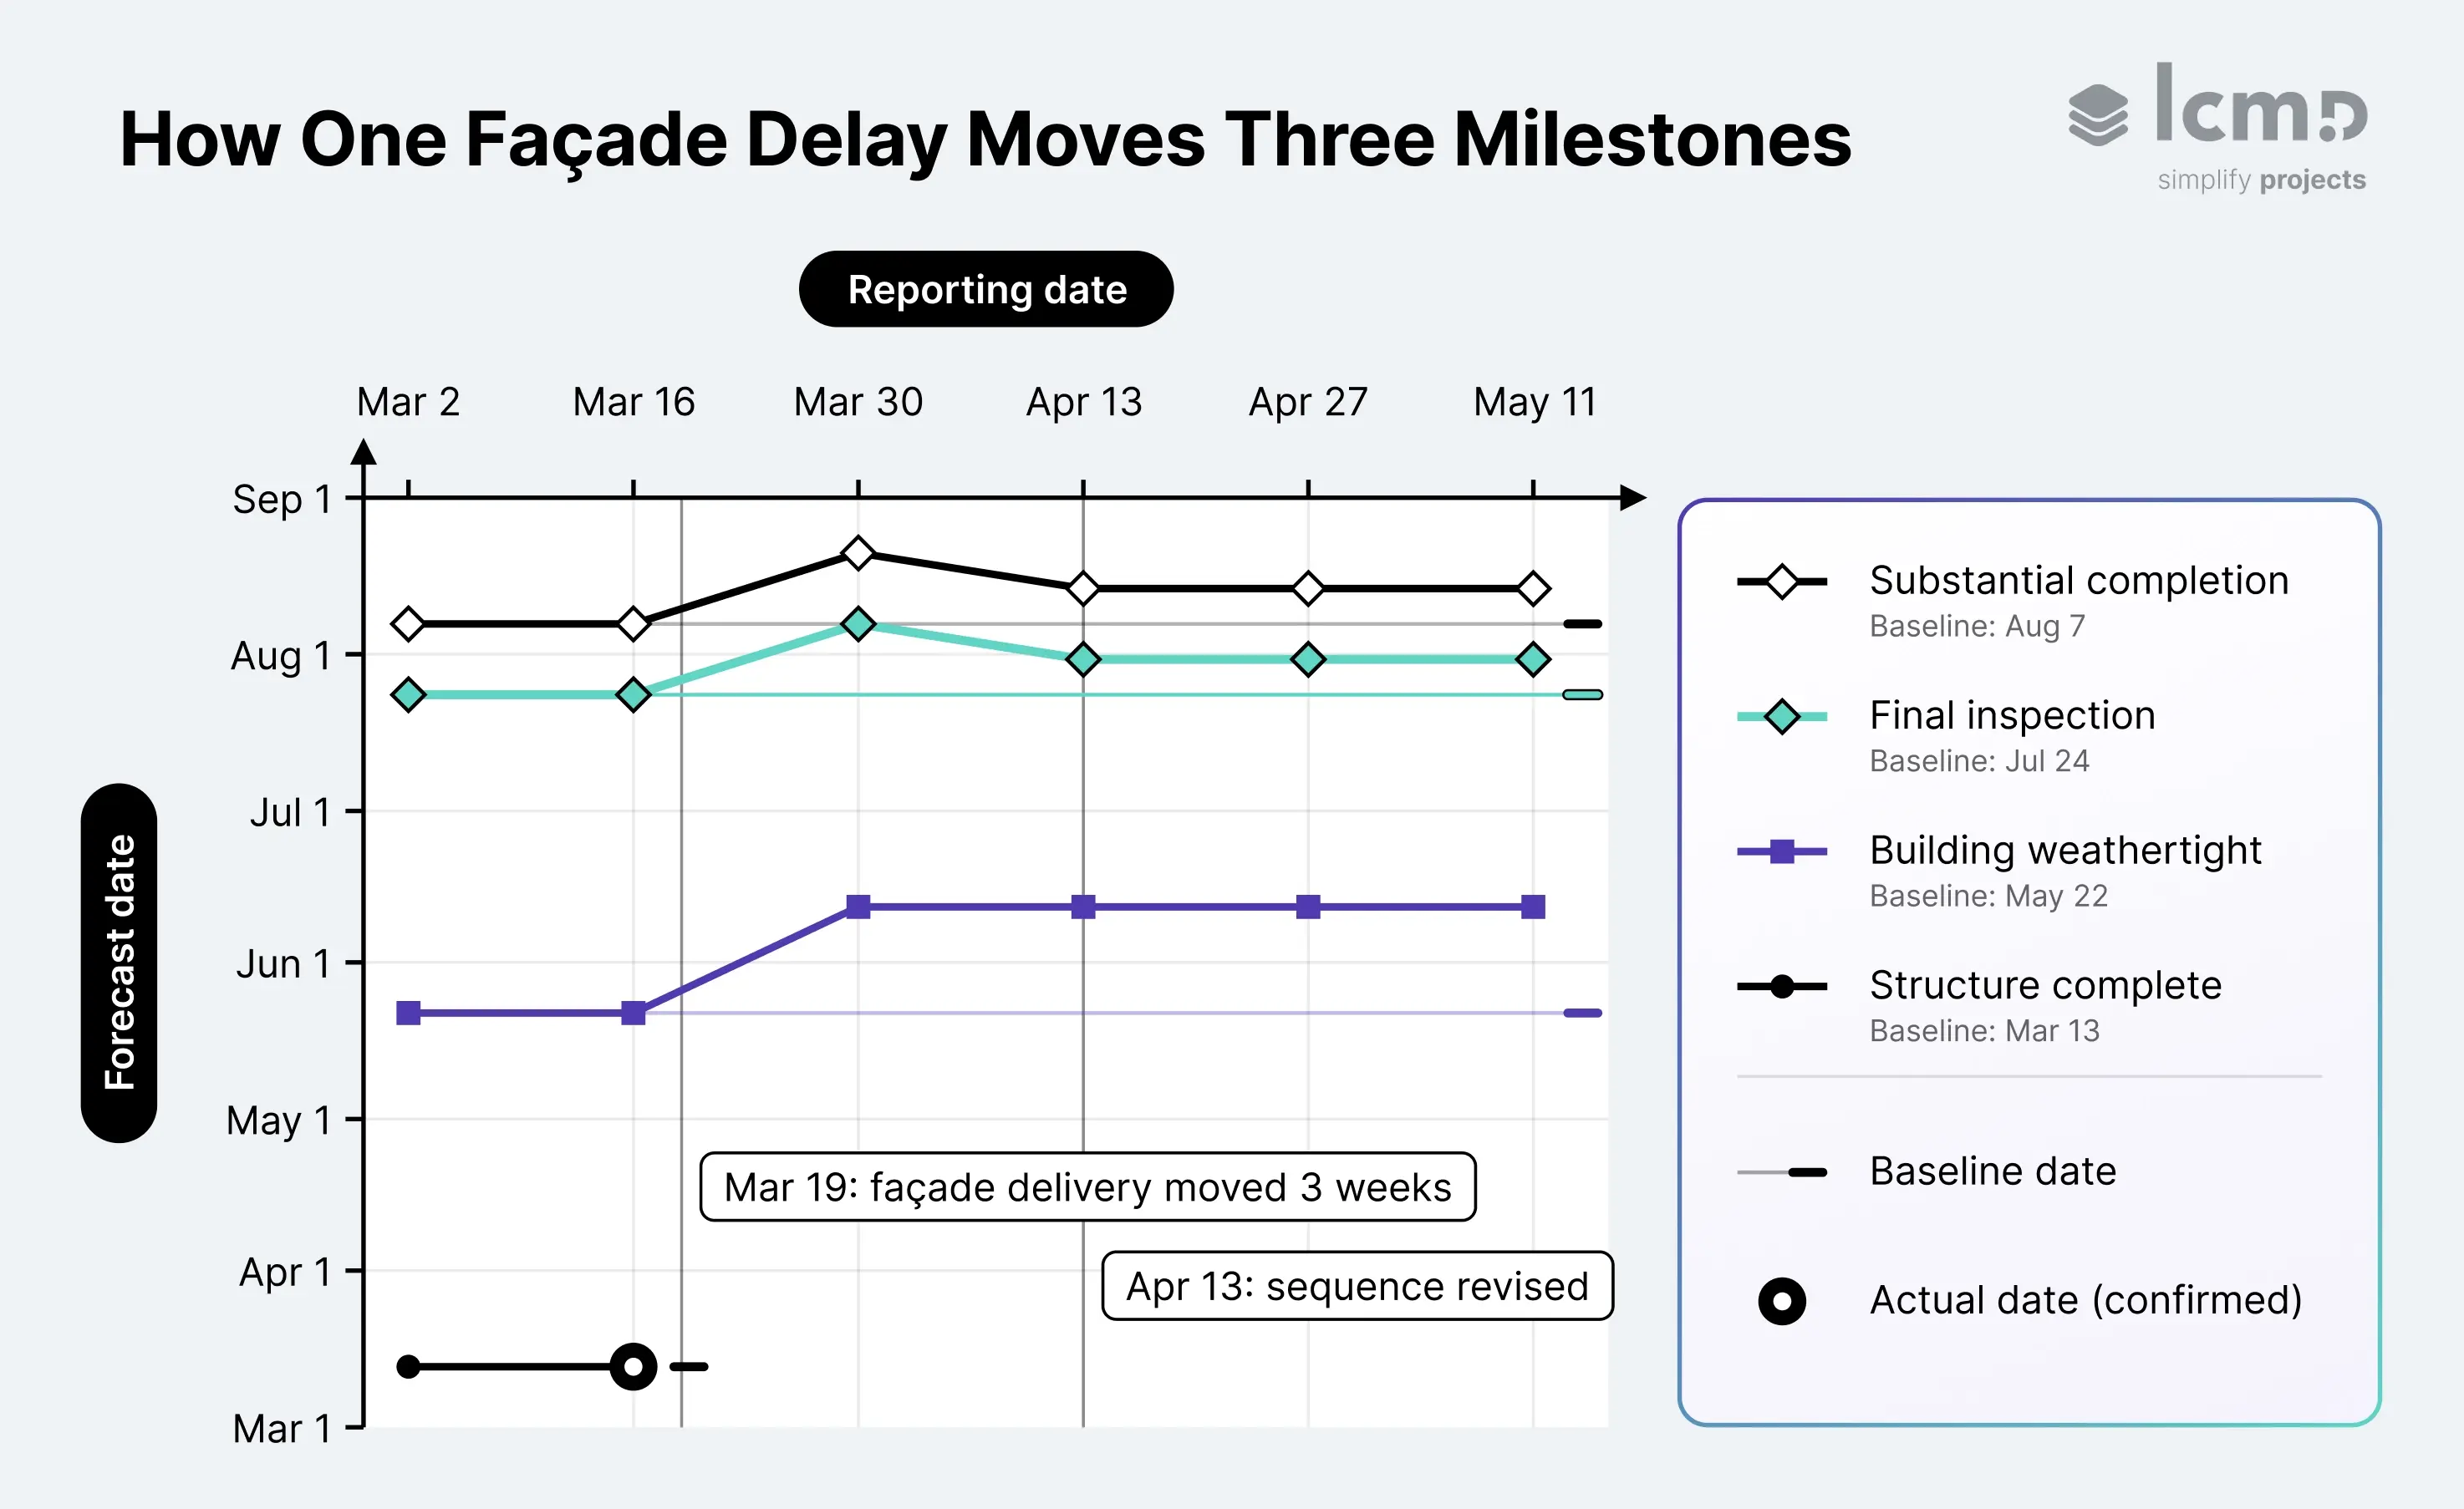
On March 19, the façade supplier moves delivery from April 6 to April 27, three weeks later. The project team enters the new date in its dependency-based schedule and checks the affected activities. The updated forecasts show:
- Building weathertight: June 12, three weeks later.
- Final inspection: August 7, two weeks later.
- Substantial completion: August 21, two weeks later.
Interior finishes now wait for the façade and are planned to start on June 15, two weeks later than before. The week of float between weathertight and MEP rough-in absorbs the rest of the delay. Once that float is used up, the façade-dependent sequence becomes the controlling path to substantial completion in this example. A change like this can also shift a project’s critical path.
One three-week delay moves three milestones by different amounts. The schedule’s dependencies and float decide how far each forecast moves.
Six Reports Trace the Changing Milestone Forecasts
The March 2 and March 16 reports show unchanged forecasts. Structure complete is reached on March 13 and confirmed at the March 16 report, where its trend line ends. On March 30, the milestone trend analysis records the revised forecasts.
At the April 13 review, the team revises the installation sequence. The façade will go up from the lower floors, so interior finishes can start on June 8 in areas where enclosure and MEP rough-in are complete by then. That is one week earlier than the delayed plan, and ahead of the June 12 weathertight milestone. The final inspection forecast moves to July 31 and substantial completion to August 14, recovering one week each. Weathertight stays at June 12, and the last two reports show no further change.
What the Forecast History Reveals About the Delay
Three lines rising at the same report suggest a shared cause. The schedule confirms it: the delayed façade delivery.
The step at March 30 stays on the chart after the April 13 forecast improvement. Anyone reading it later sees when the delay appeared, how far it reached and how the revised plan changed the forecast. Progress on site still has to prove that the revised sequence works.
The team identified the potential impact on March 19, more than four months before substantial completion was originally due.
These forecast patterns are a starting point for reading milestone trends on other construction projects.
How to Read a Milestone Trend Analysis Chart
To read a milestone trend analysis chart, follow the direction and steepness of each line between two reports. A flat line means the forecast holds. A rising line means the milestone moved later, and a falling line means it moved earlier. Steeper segments indicate larger forecast revisions over the same reporting interval.
Five patterns deserve closer attention on construction projects:
On the same scales, the vertical gap between a line and the diagonal is the time left until the forecast date. A rising trend with a wide gap is an early warning. The options still open depend on the remaining work, its dependencies and unresolved constraints.
Each pattern shows where to look, and the next step is finding the reason behind the move.
Why Did the Milestone Move?
A milestone forecast moves when something in the work leading to it changes: a delivery date, an approval, crew availability, the release of a work area or the sequence of work. The chart alone cannot say which one.
What a Milestone Trend Chart Cannot Show
A milestone trend chart records how forecast dates develop across reports. It shows no dependencies, so it cannot tell which activities pushed a milestone or which other work is affected. It names no causes. Each point is only as reliable as the forecast behind it, given by someone on the project team or calculated from the schedule. Milestone trend analysis complements measures such as schedule variance, which compare progress with the plan at a single reporting date.
Tracing a Moved Date to Its Cause
The most reliable reason is the one recorded when the date moves. In the façade example, the cause was known on March 19, eleven days before the next report. A reason recorded at that moment stays precise. Weeks later, it often shrinks to “site delays.”
Four questions lead from the moved date to its cause, and each draws on different evidence:
- Did the forecast move, and by how much? The milestone trend chart and its successive forecast dates.
- Why did it move? The recorded reason, checked against activity status and the people doing the work.
- What else is affected? Activity dependencies and remaining work in the updated schedule.
- What was originally planned? The original approved baseline.
Keeping the Original Baseline in View
Comparing forecasts with the original baseline shows how far a milestone has moved since the plan was approved. That comparison depends on the original staying available. In a review of 36 major U.S. federal building projects completed in fiscal years 2014 to 2018, the GAO reported that 25 had been rebaselined. Many of these revisions were legitimate. Tenant-requested changes were at least part of the reason for 18 of them.
The risk lies in what gets reported. Measuring performance only against the most recent baseline “may obscure how projects have performed,” the GAO warns. Each approved revision sets a new reference. When only the latest one is reported, the distance from the original plan drops out of view.
Keep the original baseline next to every approved revision. The milestone trend analysis can then show the full distance between today’s forecast and the date first approved.
Once the cause and the affected work are clear, the team can decide how to respond.
What to Do When a Milestone Trend Rises
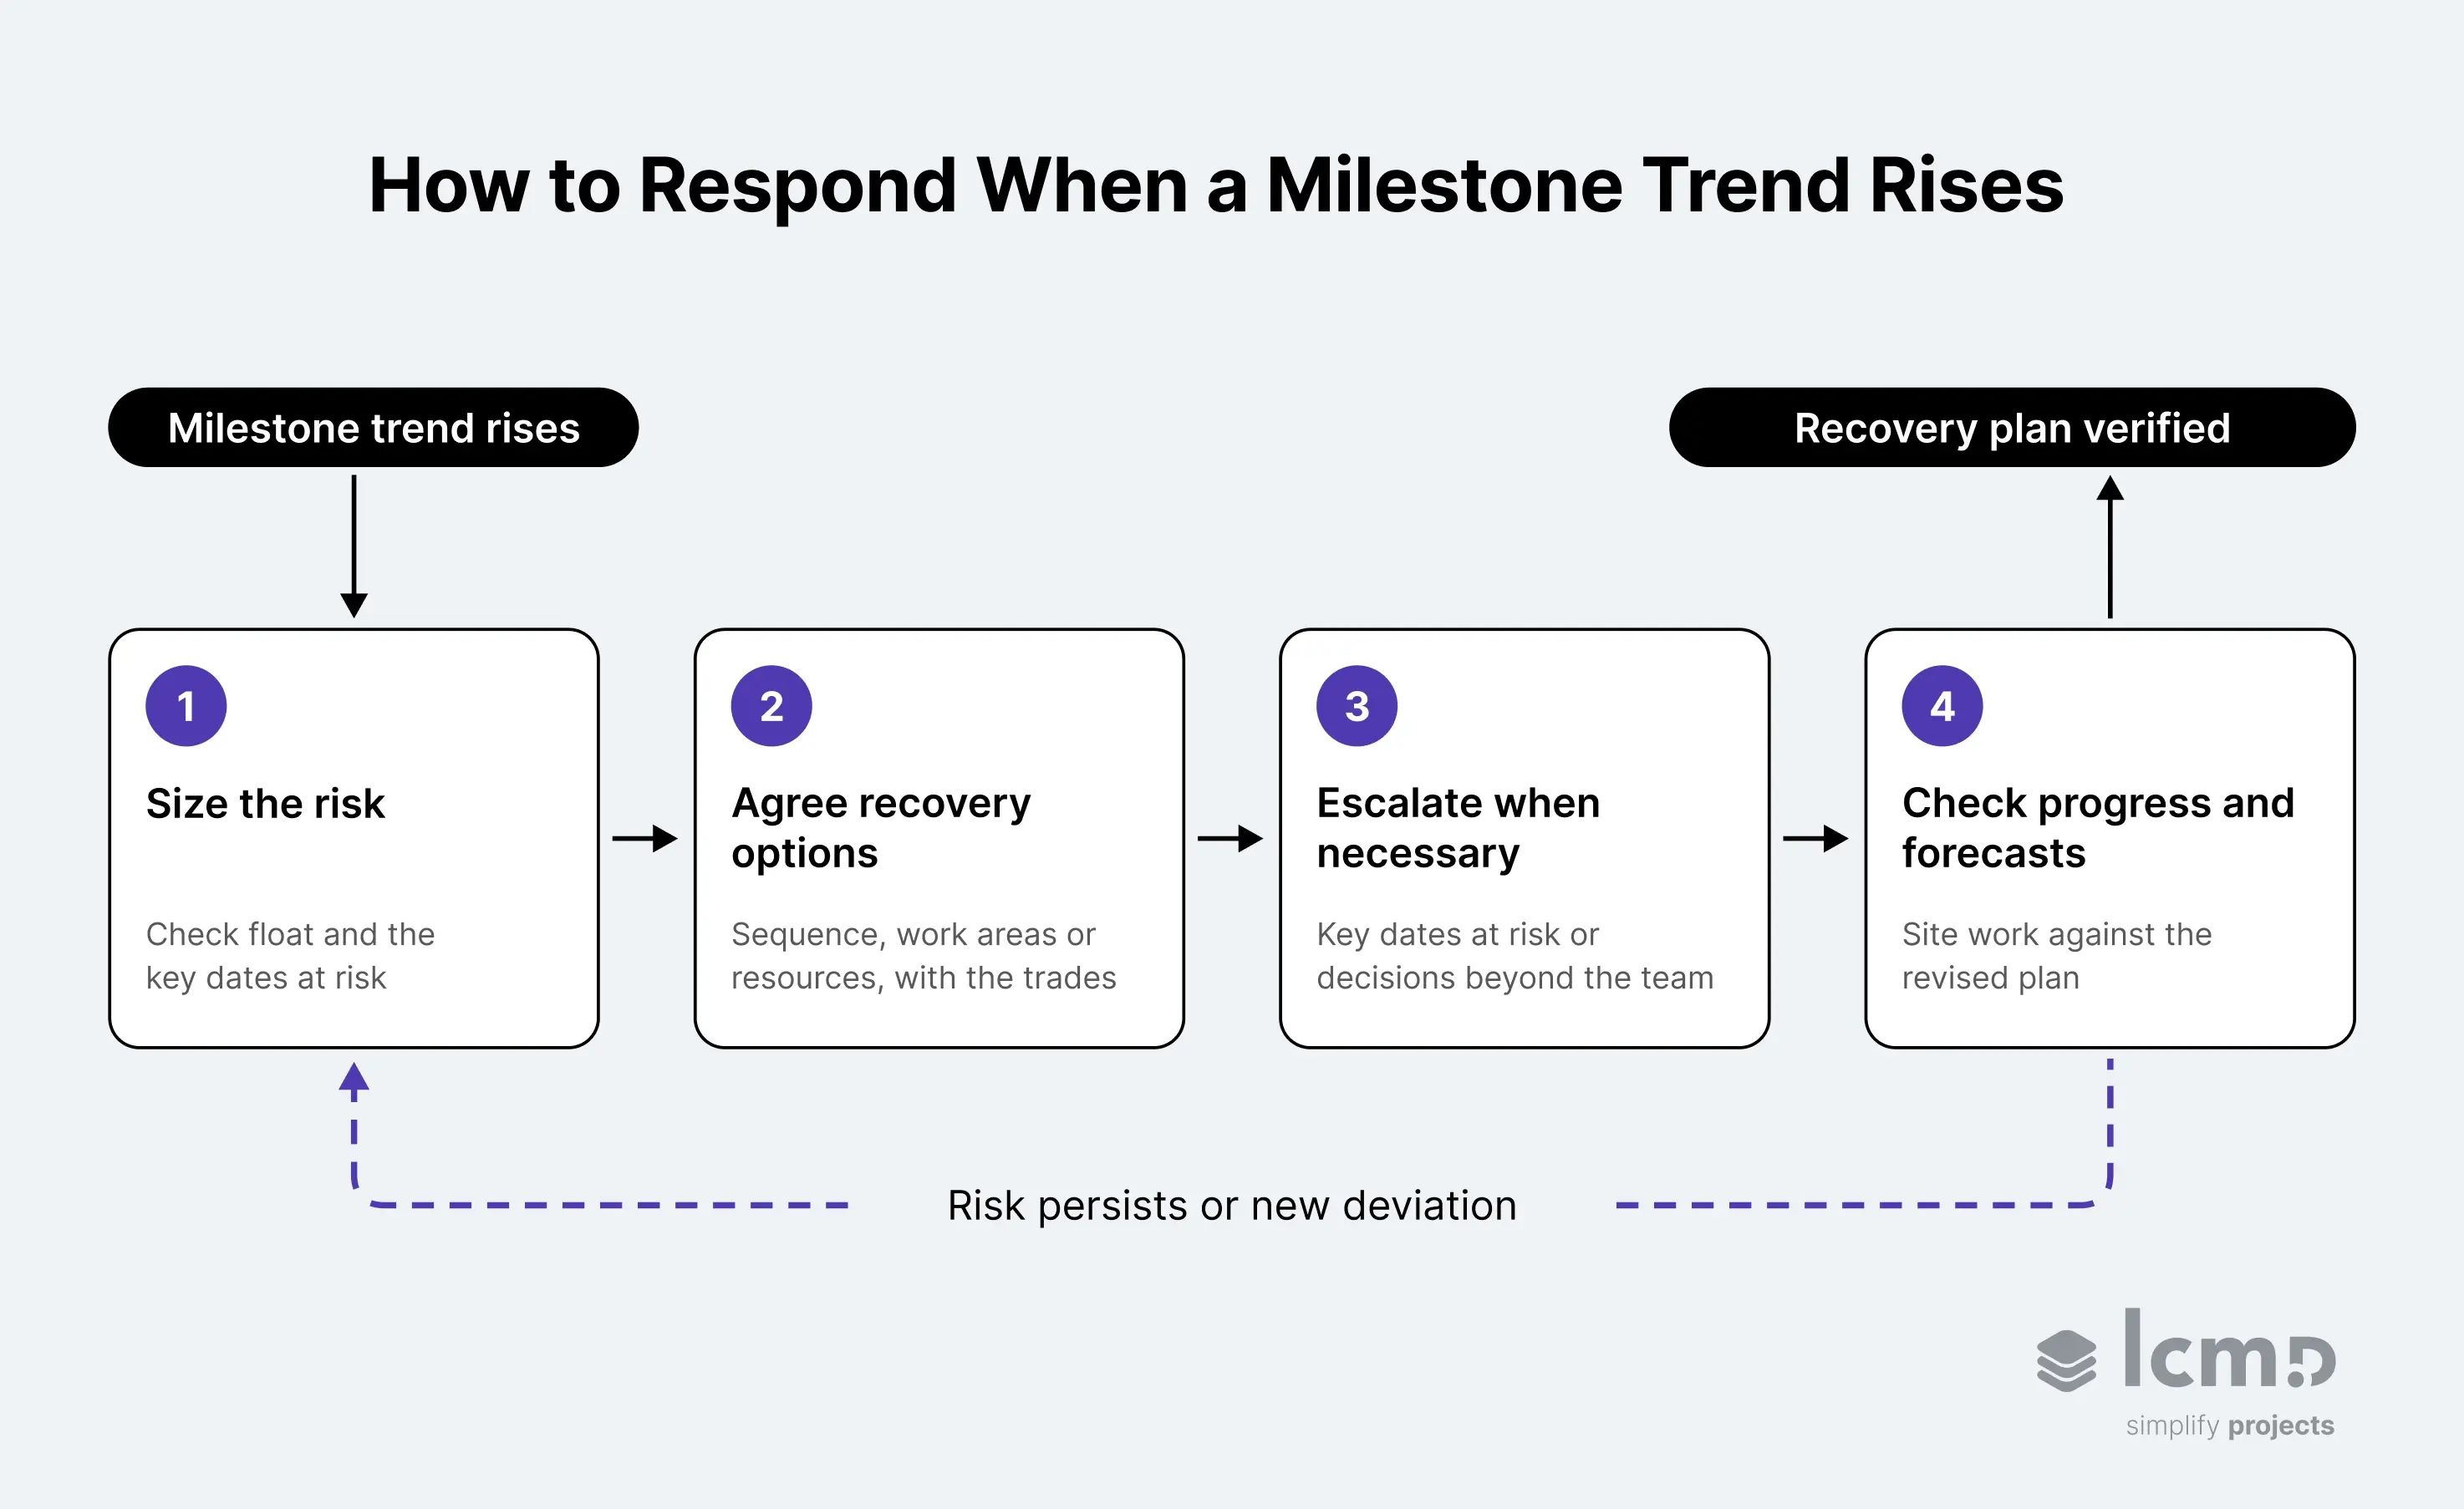
A rising trend calls for a response well before the next report. Four steps keep it focused:
- Size the risk. Check how much float remains and which key dates the move puts at risk.
- Agree recovery options with the trades involved. Resequencing, additional work areas or extra resources can each recover time. In the façade example, the team planned to start interior finishes on the lower floors first.
- Escalate when necessary. Raise key dates at risk, or decisions beyond the team’s authority, with the responsible stakeholders. Use the trend and the verified cause as evidence.
- Check progress and forecasts. Track progress against the revised plan and review the forecasts at the following reports. Return to step 1 if a risk persists or a new deviation appears.
A flat line after a corrective action confirms only that the forecast held. Evidence from site, such as the delayed delivery actually arriving, shows whether the cause is resolved.
A response this quick depends on how the milestone trend analysis is set up.
Setting Up a Milestone Trend Analysis on a Construction Project
Five decisions shape a milestone trend analysis the project team can rely on:
- Choose the milestones. Pick milestones that drive project decisions, each with a clearly defined and verifiable completion criterion, such as “façade installed and sealed.” Keep the list short enough to review in one meeting. The milestone planning of a Last Planner process is a good starting point.
- Record the baseline date. Enter the approved date for each milestone before the first report.
- Decide who submits and who validates each forecast. Usually the person responsible for that scope submits it, and the project manager checks it against the updated schedule and progress on site.
- Tie the cadence to the existing reporting cycle. Record the forecasts at every project report and save each set as a separate snapshot.
- Review moved dates in a standing meeting. Check each move against the reason recorded when the change became known.
A spreadsheet can handle the analysis if every reporting snapshot is preserved. The risk grows as more people send dates, because each overwritten snapshot removes a point from the trend.
Whatever the tool, a milestone trend analysis is most useful when it stays connected to the current schedule.
Connecting Milestone Trends to the Current Construction Schedule
Answering the question from the opening takes two kinds of information: what a change affects in the current schedule, and how the outlook for key dates has developed since.
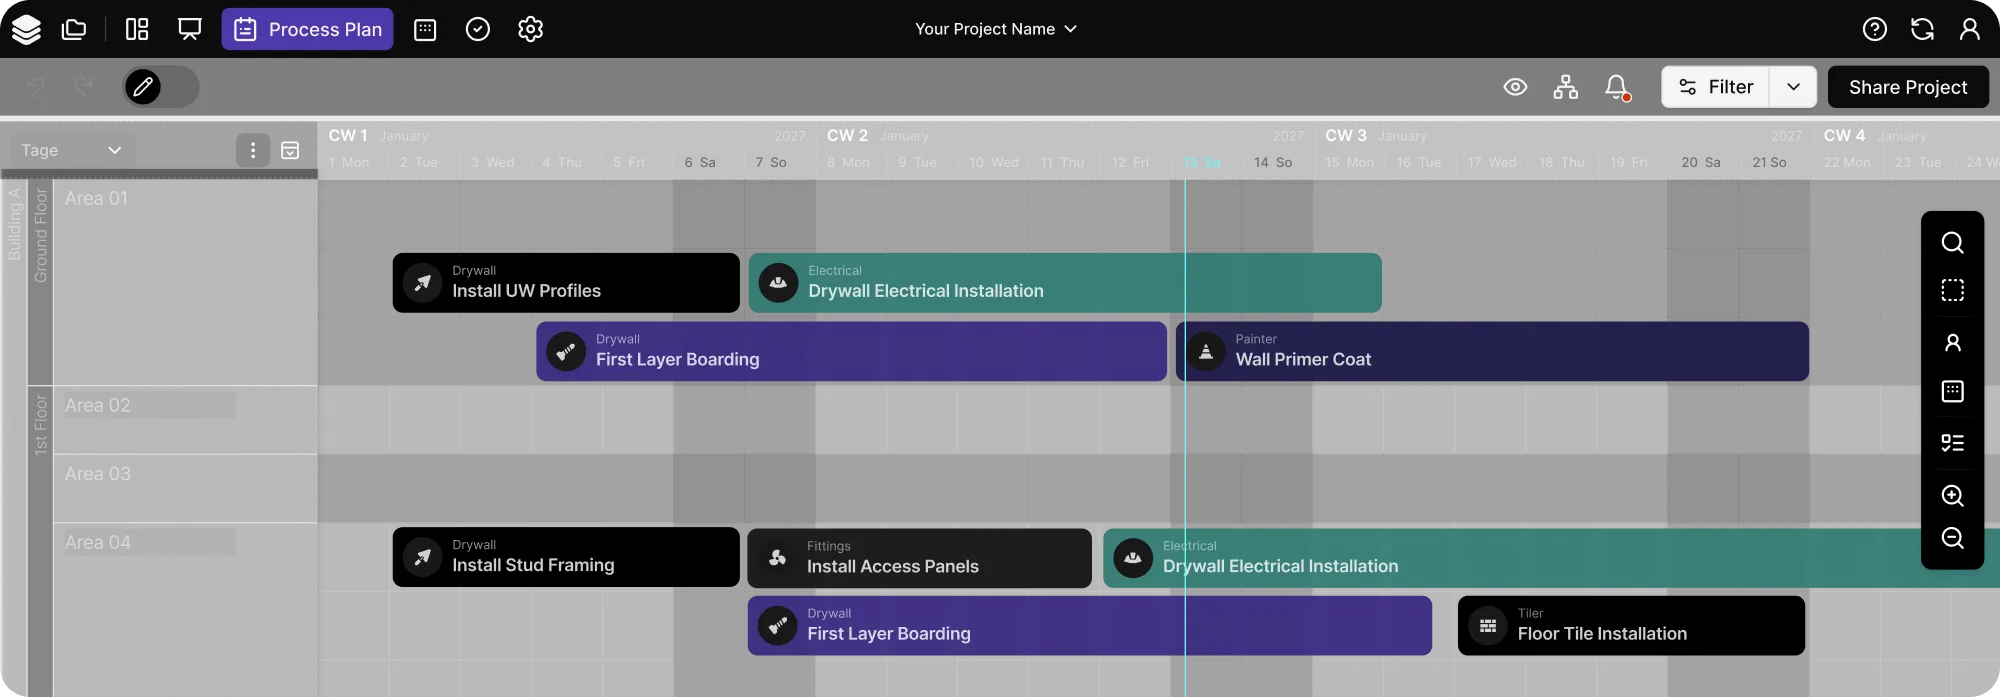
Lcmd covers the first in its process plan. Dependencies link the activities. The change history records who changed what and when, which processes were affected, the end date before the change and the reason given. The milestone view and the baseline comparison show where key dates stand against the approved plan. The reason is captured with the change itself.
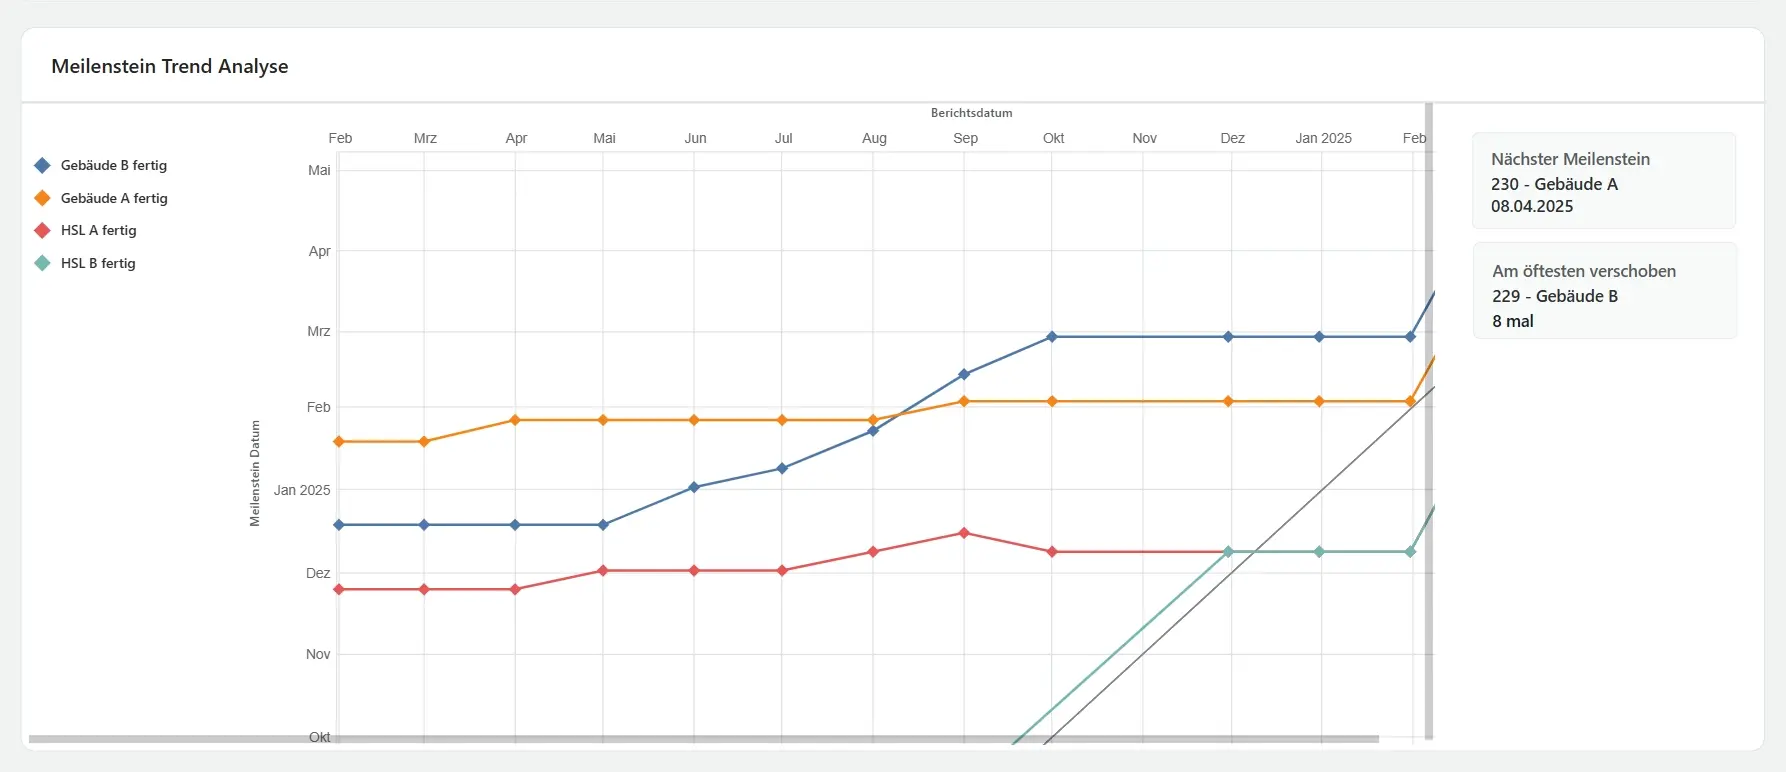
For the second, milestone trend analysis is available as a beta in the extended Power BI dashboard. Lcmd sets up the extended dashboard for a project on request. The chart shows each milestone shift as a step up or down. An info box names the next milestone and the one moved most often.
Completion Dates Backed by Forecast History
Behind every committed completion date sits a forecast that the team reviews at each report. Milestone trend analysis keeps the history of that forecast, so each date comes with a record of how it developed. A schedule change identified early, with its cause recorded, leaves the team time to act and evidence to support its decisions.
Recorded reasons help project teams explain revised completion forecasts to owners and stakeholders. Recurring causes of milestone movement point to constraints worth addressing on future projects. A completion date earns trust from the history behind it.
{{cta}}
Milestone Trend Analysis FAQs
Can Milestone Trend Analysis Show Schedule Changes in Real Time?
Milestone trend analysis is a periodic method that shows schedule changes at each reporting date. For immediate visibility, teams update the current schedule when a change arrives and check its effect on dependent activities. The next report adds the revised forecast to the trend. A constant reporting interval keeps the slopes on the chart comparable.
Can You Build a Milestone Trend Analysis From a Primavera P6 or Microsoft Project Schedule?
A milestone trend analysis can be built from forecast dates exported from Primavera P6 or Microsoft Project at each reporting date. In Excel, a scatter chart with straight lines shows the trend, with one extra series for the diagonal. Power BI can draw the same chart from the stored exports.
How Does Milestone Trend Analysis Fit With the Last Planner System?
Milestone trend analysis complements the Last Planner System by tracking the milestones its weekly plans lead to. Percent Plan Complete (PPC) measures how reliably the trades complete their weekly commitments. When weekly commitments are missed repeatedly, the current schedule shows whether an upcoming milestone is affected.
Is a Milestone Trend Analysis the Same as a Milestone Chart?
A milestone trend analysis differs from a milestone chart, which shows planned milestone dates at a single point in time. The diamond symbols for milestones in a Gantt chart are a typical milestone chart. Milestone trend analysis adds the forecast history those symbols leave out.
What Are the Benefits of Milestone Trend Analysis?
Milestone trend analysis shows early whether key dates are holding, and it keeps every earlier forecast on record. Teams see delays while they can still act, and owners see how a completion date developed. The method’s limits are equally clear: the chart shows neither causes nor dependencies, so it works best alongside the current schedule.